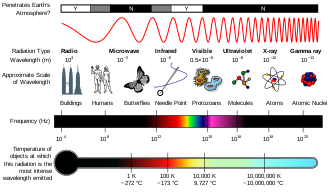
In the physical sciences, the term spectrum was introduced first into optics by Isaac Newton in the 17th century, referring to the range of colors observed when white light was dispersed through a prism.[1][2] Soon the term referred to a plot of light intensity or power as a function of frequency or wavelength, also known as a spectral density plot.
Later it expanded to apply to other waves, such as sound waves and sea waves that could also be measured as a function of frequency (e.g., noise spectrum, sea wave spectrum). It has also been expanded to more abstract "signals", whose power spectrum can be analyzed and processed. The term now applies to any signal that can be measured or decomposed along a continuous variable, such as energy in electron spectroscopy or mass-to-charge ratio in mass spectrometry. Spectrum is also used to refer to a graphical representation of the signal as a function of the dependent variable.
- ^
 OpenStax Astronomy, "Spectroscopy in Astronomy". OpenStax CNX. September 29, 2016 "OpenStax CNX". Archived from the original on February 17, 2017. Retrieved February 17, 2017.
- ^ Newton, Isaac (1671). "A letter of Mr. Isaac Newton … containing his new theory about light and colours …". Philosophical Transactions of the Royal Society of London. 6 (80): 3075–3087. Bibcode:1671RSPT....6.3075N. doi:10.1098/rstl.1671.0072. The word "spectrum" to describe a band of colors that has been produced, by refraction or diffraction, from a beam of light first appears on p. 3076.
© MMXXIII Rich X Search. We shall prevail. All rights reserved. Rich X Search
